
Key Insights:
- Solana’s price remains below recent highs as the network processed 14.2 billion transactions in Q3.
- Solana network activity jumped 45% from Q2, marking a quarterly record.
- ETF inflows and rising usage add support to the SOL crypto price narrative.
Solana price has become an unusual story this quarter. Network usage is accelerating while SOL remains below its recent highs.
Solana processed a record 14.2 billion non-vote transactions in Q3, up 45% from Q2, according to Blockworks data cited by Solana on Oct. 3. Non-vote transactions exclude validator voting and focus more closely on activity involving users and applications.
The gap between that network record and the token chart is where the story gets interesting. SOL entered October near $119, according to CoinGecko historical data. It closed Oct. 1 at $118.38, after reaching a late-September high above $124.
Solana Price and the Network’s Busiest Quarter
The Solana network recorded its highest quarterly total for non-vote activity, according to Blockworks figures. That number includes user-driven actions such as transfers, swaps, and decentralized application activity.
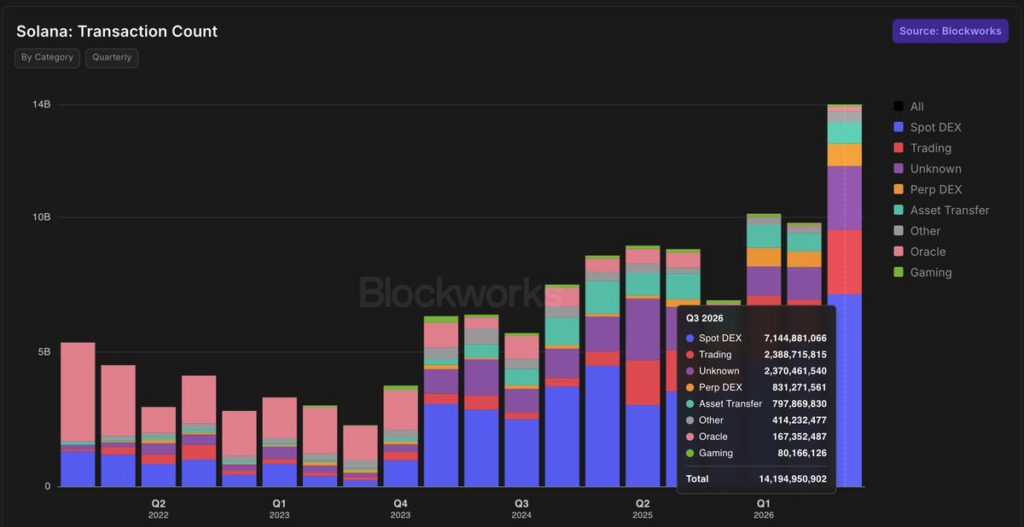
It excludes validator vote traffic, which can make raw blockchain transaction figures harder to compare.
For the Solana price, however, there is no automatic link between more transactions and a higher token valuation. The Q3 record shows activity. It does not establish that the activity caused SOL to rise.
Still, the timing stands out. SOL fell to a Sept. 16 close of $98.54 before climbing back above $120 later in the month.
SOL Crypto Price Meets Crowded Resistance Zone
The immediate Solana price question is what happens around the $120-$125 range. SOL crypto price traded around $119 on Sept. 29 after retreating from $125. The Coin Republic reported that $120 and $125 were the main levels traders were watching.
Ali Charts also pointed to $150 as a higher target after tracking U.S. spot Solana ETF accumulation.
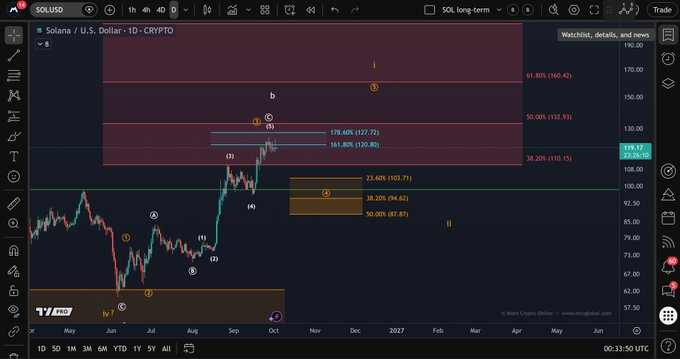
More Crypto Online offered a more cautious technical view on Oct. 1. The analyst said SOL was showing signs of moving toward an $87.8-$103.7 support zone, while another short-term high remained possible.
That creates a wider map for the SOL crypto price. A move above $125 would clear the recent September peak.
A decline puts the $115-$188 area back into focus, followed by $111, per the chart analysis cited by The Coin Republic. The levels are technical markers, not guarantees.
ETF Demand Adds Another Layer
Network activity is not the only number drawing attention. Ali Charts reported that U.S. spot Solana ETFs accumulated roughly 4.37 million SOL from July 13 through Sept. 25.
The Coin Republic said completed-week ETF inflows reached $188.1 million over Sept. 21-25. The same report placed SOL near $119 on Sept. 29, after the token retreated from its $125 area.
That ETF demand adds another variable to track for Solana’s price. ETF buying does not mean SOL must rise. It provides a separate measure of market demand beyond on-chain usage.
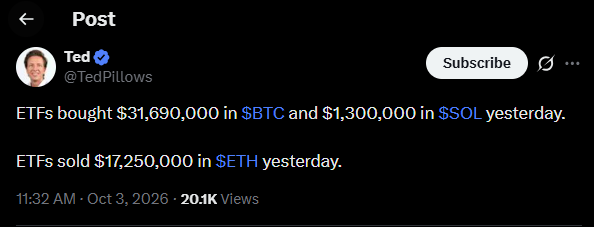
Ted Pillows also highlighted a $9 million SOL whale purchase during the week. His post said, “Smart money is more focused on alts now.”
Solana Network Activity Meets a Technical Test
The Solana network is entering the fourth quarter with a record activity figure behind it. SOL, however, still has to navigate the resistance and support levels traders have been marking.
More Crypto Online’s latest chart identifies $132.93 and $160.42 as the next resistance levels. The analyst sees $103.71 as an important line for the current structure. The same analysis puts deeper support at $94.62 and $87.87.
That leaves the Solana price caught between strong network data and a chart that has not yet broken decisively higher.
For the SOL crypto price, the next few moves will show whether record on-chain activity is accompanied by stronger price momentum. The Solana network is busier than ever. The token chart still has something to prove.
The post Solana Price: What the Charts aren’t Telling You appeared first on The Coin Republic.

 Rupam Roy